
At its core, calculating customer lifetime value is about understanding three fundamental levers: how much a customer spends, how often they spend, and how long they remain a customer. A clear grasp of these figures enables you to accurately predict the total revenue a single customer will contribute to your business over time.
Why CLV Is Your Most Important Growth Metric
It’s exceptionally easy to become distracted by vanity metrics like website traffic or social media followers. While these numbers might provide a short-term ego boost, they are not reliable indicators of sustainable growth. This is where Customer Lifetime Value (CLV) provides critical clarity, pulling your focus from fleeting wins towards long-term, genuine profitability.
Simply put, CLV represents the total net profit you can expect from an average customer throughout their entire relationship with your business. It transcends single sales to tell the complete story of their financial worth.
Moving Beyond Acquisition Costs
For a long time, the primary metric for growth was Customer Acquisition Cost (CAC) – the expense of getting a new customer through the door. While CAC remains a crucial number, an over-reliance on it can lead to the classic "leaky bucket" problem. You become so focused on pouring new customers in that you fail to notice existing ones quietly slipping away.
Learning how to calculate customer lifetime value fundamentally flips this perspective. It compels you to consider the entire customer journey, not just the initial conversion. This is especially vital for subscription-based companies, a topic we explore in detail in what a SaaS business is in our definitive guide to the subscription model.
By focusing on CLV, you shift from thinking "How do we get more customers?" to asking a much more strategic question: "How do we create more valuable customers?" This subtle change in perspective is the foundation of a resilient, profitable business.
Before delving into the formulas, let’s quickly break down the key components you'll be working with. Each one tells a part of the customer story.
Core Components of CLV Calculation
Metric ComponentWhat It MeasuresWhy It's ImportantAverage Purchase ValueThe average amount a customer spends in a single transaction.Informs the immediate value of each sale.Purchase FrequencyHow often a customer makes a purchase within a specific timeframe.Indicates customer engagement and loyalty.Customer Lifetime SpanThe total duration a person remains an active, paying customer.Determines the time window available for revenue generation.
A solid grasp of these components is the first step. They are the building blocks for all subsequent calculations, providing a complete picture of customer behaviour and value.
The Strategic Power of Knowing Your CLV
When you know your CLV, you are equipped to make smarter, data-backed decisions across the entire business. It becomes a reliable compass, guiding your strategy.
Here’s how it helps in practice:
- Smarter Marketing Spend: Understanding what a customer is worth tells you precisely how much you can afford to spend acquiring them. A high CLV can provide the confidence to invest in more competitive advertising channels or increase your marketing budget.
- Improved Customer Retention: CLV shines a spotlight on the financial impact of keeping existing customers satisfied. It creates a clear business case for investing in superior customer service, loyalty programmes, and product enhancements that foster long-term relationships.
- Informed Product Development: By segmenting customers and analysing their CLV, you can pinpoint which features or services your most valuable customers appreciate. This insight is invaluable for prioritising your product roadmap and investing in developments that genuinely drive loyalty.
The UK market, for example, is experiencing a major influx of new consumers, making a focus on CLV more critical than ever. Attracting them is one thing; retaining them is what drives profitability. In fact, research shows that in some UK sectors, the top 25% of customers can account for up to 75% of total sales. This underscores why personalised retention strategies are so vital.
Ultimately, CLV is more than a number on a dashboard; it’s a business philosophy. It nurtures a customer-centric mindset that builds a foundation for real, sustainable growth. You stop chasing one-off sales and start building lasting value.
Building Your Data Foundation for Accurate CLV
Any CLV calculation is only as reliable as the data fuelling it. Think of it like baking a cake; using salt instead of sugar will render the result useless, regardless of how perfectly you follow the recipe. The same logic applies here. Inaccurate data leads to flawed insights, which can steer your entire business in the wrong direction.
To truly understand how to calculate customer lifetime value, you must first become methodical in your data gathering. This doesn't require a PhD in data science; it simply demands a systematic approach to extracting core metrics from the systems you use daily.
The objective is to build a dataset that is clean, reliable, and organised. This preparatory work is the most critical part of the process, ensuring the calculation models we'll discuss provide genuinely useful intelligence. Let's break down where to find these essential pieces of the puzzle.
Finding Your Average Purchase Value
First, you need your Average Purchase Value (APV). This figure represents the average amount a customer spends in a single transaction. It is a foundational metric and typically one of the more straightforward figures to obtain.
So, where can you find APV data?
- E-commerce Platforms: Systems like Shopify or BigCommerce offer excellent built-in analytics. You will usually find APV under a "Reporting" or "Analytics" tab, often pre-calculated over various time periods.
- CRM Systems: Your Customer Relationship Management software (e.g., Salesforce, HubSpot) houses your sales deals and order values. You can export this data and calculate the average yourself by dividing total revenue by the number of orders.
- Billing Software: For SaaS or other subscription businesses, platforms like Stripe or GoCardless provide detailed transaction histories. A quick analysis of this data will yield the average payment amount per invoice.
Pulling data from different sources is key for accuracy. For instance, a wealth of information can be hidden in customer emails. Understanding email parsing best practices can help you centralise this data so it is not overlooked.
Deriving Your Purchase Frequency
Next is Purchase Frequency (PF). This metric indicates how often a customer buys from you within a defined timeframe, such as a year. It's an excellent indicator of customer loyalty and brand engagement.
Unlike APV, Purchase Frequency typically requires a simple calculation: divide the total number of orders by the number of unique customers over the same period. For example, if you had 1,000 orders from 250 unique customers in one year, your average Purchase Frequency is 4.
A high purchase frequency is a positive sign, pointing to a healthy, sticky product. Conversely, a decline can be an early warning of churn, providing an opportunity to intervene before losing a customer permanently.
Estimating Your Customer Lifespan
The final core component is the Customer Lifespan: the average duration a person remains an active, paying customer. This can be the most challenging metric to determine, particularly for newer businesses without years of historical data.
Expert Insight: A lack of long-term data should not be a barrier. Newer businesses can derive a solid estimate using their churn rate. The formula is straightforward: Customer Lifespan = 1 / Churn Rate. Therefore, if your monthly churn is 5% (0.05), your estimated customer lifespan is 20 months (1 / 0.05).
As your business matures, you can replace this estimate with actual historical data for greater precision. The important thing is to start with a reasonable, data-backed figure rather than a guess. This provides a solid baseline for your initial CLV calculation, which you can then refine over time.
With these three data points in hand, you are ready for the calculation itself.
Practical CLV Models You Can Use Today
Moving from theory to practice is where you unlock real value. Knowing you should calculate customer lifetime value is one thing; knowing how to do it with your own data is another. The good news is you do not need a data science degree to begin. Several accessible models exist, each offering a different level of detail and insight.
The key is to start with what is manageable for your business and build from there. Let's walk through three of the most effective CLV models, complete with real-world examples from a fictional UK-based online business. This will provide a clear roadmap for applying these formulas, regardless of your technical background.
Generally, the process breaks down into three core actions: calculating your average purchase value, determining purchase frequency, and estimating customer lifespan.
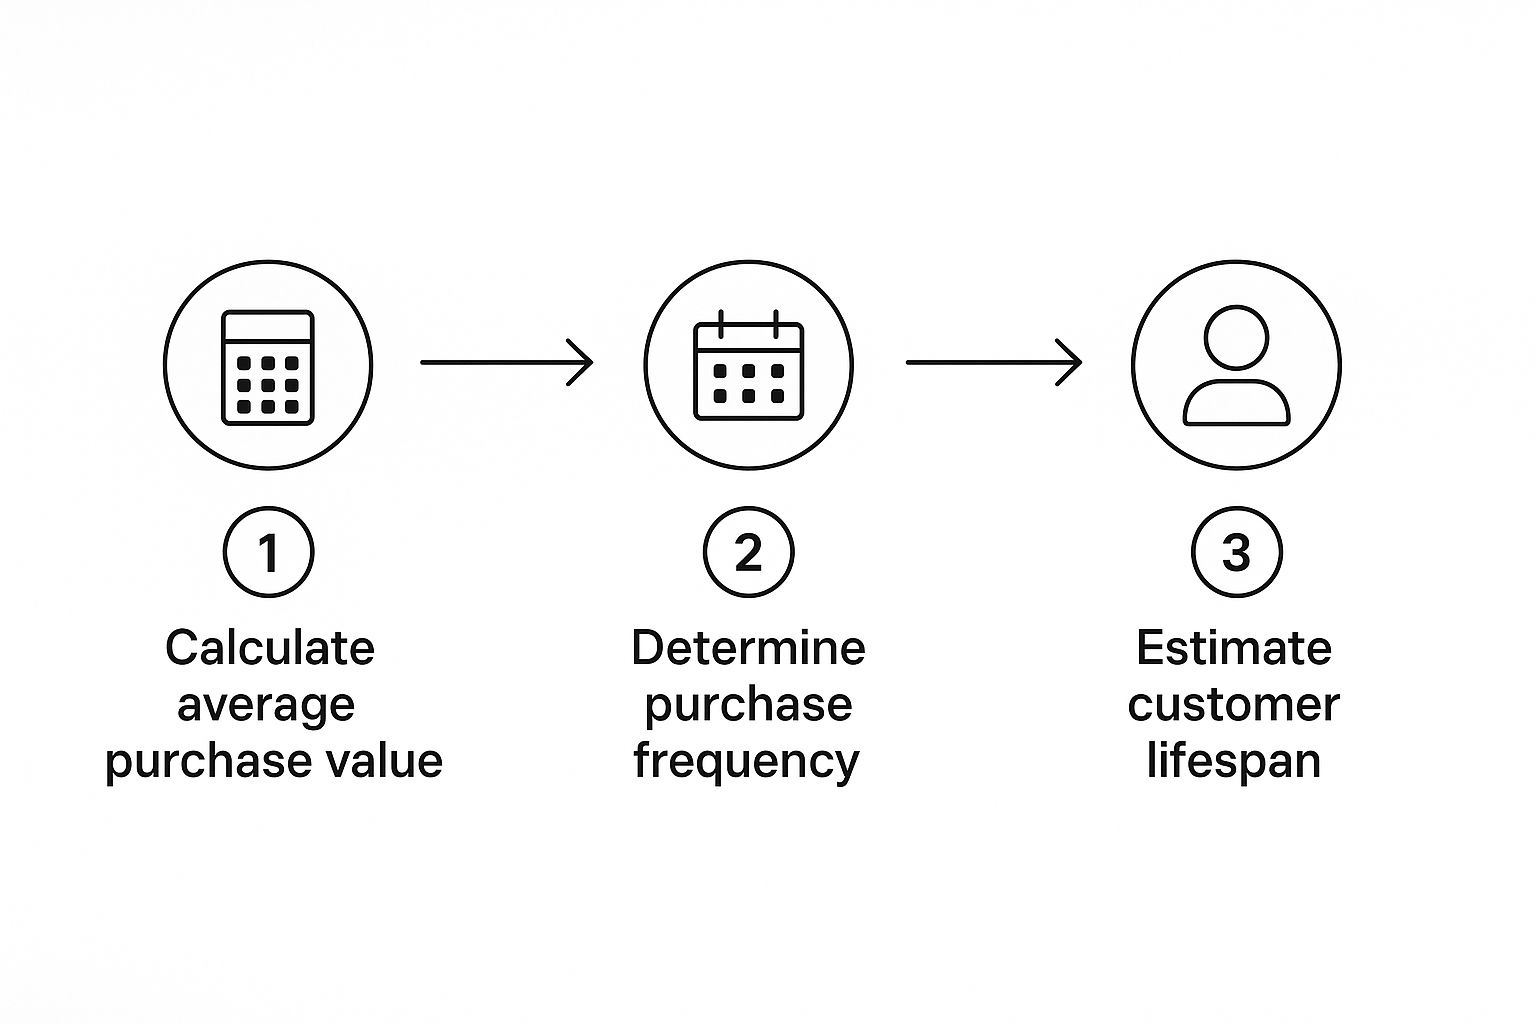
As you can see, breaking the calculation into smaller, manageable steps makes the entire process far less intimidating. It is much easier to tackle when you focus on one piece of data at a time.
The Historic CLV Model: A Retrospective View
The simplest entry point is the Historic CLV model. This method calculates the total gross revenue a customer has generated to date. Because it is based entirely on past data, it is incredibly straightforward to calculate and provides an excellent initial benchmark.
This model is ideal for businesses just beginning their CLV journey. It yields a solid, factual number based on real transactions, offering a clear picture of past performance without forecasting or guesswork.
The formula is a simple multiplication of the key metrics we have already discussed.
Formula:
Historic CLV = (Average Purchase Value x Purchase Frequency) x Customer Lifespan
Let’s apply this to a fictional UK-based online coffee subscription service we’ll call "The Daily Grind."
Example: The Daily Grind (Historic)
- Average Purchase Value: £20 per order.
- Purchase Frequency: Customers order, on average, 6 times per year.
- Average Customer Lifespan: Their data shows customers stay for an average of 3 years.
Calculation:
(£20 per order x 6 orders per year) x 3 years = £360 Historic CLV
This tells The Daily Grind that, historically, the average customer has been worth £360 in total revenue. It is a powerful starting point for understanding who their most valuable customers have been.
The Simple Predictive CLV Model: A Forward Look
While the historic model is useful, it only reflects what has already occurred. To make intelligent, strategic decisions, you must look ahead. The Simple Predictive CLV model does precisely that, forecasting the total revenue you can expect from a customer.
This model uses the same core metrics but projects them into the future. It offers a significant step up in strategic value by helping you understand the potential worth of your customers. This is crucial for guiding decisions on marketing spend and retention efforts.
It uses the same formula as the historic model, but the mindset is entirely different—you're forecasting, not just reporting.
Example: The Daily Grind (Simple Predictive)
Let's imagine The Daily Grind wants to forecast the value of new customers they are acquiring.
- Average Purchase Value: They expect new customers to spend £20 per order.
- Purchase Frequency: They forecast new subscribers will order 6 times per year.
- Estimated Customer Lifespan: Based on their churn data (1 / churn rate), they estimate new customers will remain for 3 years.
Calculation:
(£20 per order x 6 orders per year) x 3 years = £360 Predicted CLV
The result is the same number, but its interpretation is fundamentally different. This £360 is now a target. It informs them how much they can afford to spend to acquire a new subscriber while remaining profitable.
The Traditional Predictive CLV Model: Incorporating Profitability
For a truly sharp picture of customer value, revenue alone is insufficient. You must factor in profitability. The Traditional Predictive CLV model incorporates your gross margin, giving you a much more accurate view of a customer's net worth to your business.
This is the model we recommend for any business with a solid grasp of its financials. It moves beyond top-line revenue to reveal how much actual profit a customer generates over their lifetime. This is the figure that should guide your most important strategic decisions.
Formula:
Traditional CLV = ((Average Purchase Value x Purchase Frequency) x Gross Margin) x Customer Lifespan
Example: The Daily Grind (Traditional Predictive)
Let's refine The Daily Grind's calculation by adding their profit margin.
- Average Purchase Value: £20
- Purchase Frequency: 6 orders per year
- Gross Margin: After the cost of coffee beans, packaging, and shipping, they have a 25% (0.25) gross margin on each order.
- Customer Lifespan: 3 years
Calculation:
((£20 per order x 6 orders per year) x 0.25) x 3 years = £90 Traditional CLV
This £90 figure is profoundly more insightful than the £360 revenue number. It reveals that the actual profit from an average customer over three years is £90. This is the number you should compare against your Customer Acquisition Cost (CAC) to determine your true return on investment.
To help you decide which model fits your needs, here's a quick comparison.
Comparison of CLV Calculation Models
ModelKey Formula ComponentsBest ForProsConsHistoric(Avg. Purchase Value x Purchase Freq.) x LifespanBusinesses new to CLV, quick performance checks.Simple to calculate, based on factual past data.Backward-looking, does not predict future value.Simple Predictive(Avg. Purchase Value x Purchase Freq.) x LifespanForecasting, setting acquisition budgets.Forward-looking, aids strategic planning.Relies on estimates, can be less precise than complex models.Traditional Predictive((Avg. Purchase Value x Purchase Freq.) x Gross Margin) x LifespanBusinesses with clear cost data, determining true profitability.Highly accurate, focuses on profit, ideal for ROI analysis.Requires more financial data (gross margin).
Choosing the right model depends on your data maturity and strategic objectives. Do not hesitate to start with the historic model to gain confidence, then progress to predictive models as your data quality improves.
Implementing even the simplest of these can transform your business strategy. For more complex needs, like building a custom platform with built-in analytics, exploring specialised development services can provide a solution tailored specifically to your requirements.
The Hidden Value of Emotional Loyalty
While models and formulas provide a solid financial baseline, an expert approach to CLV must accept a simple truth: human behaviour is not merely transactional. The most valuable, profitable customer relationships are built on something far more powerful.
This is the power of emotional loyalty. It's the genuine connection a customer feels with your brand, and it is a massive, often overlooked, driver of lifetime value.
A customer who feels seen, understood, and valued will not be easily swayed by a competitor's discount. Their loyalty is earned, not bought. This is the point where you graduate from simply calculating CLV to actively increasing it. This emotional bond translates directly into more repeat purchases, enthusiastic referrals, and a business that is far more resilient to churn.
Beyond Discounts and Deals
Transactional loyalty is fragile, built on flimsy foundations like price, convenience, or a temporary offer. As soon as a better deal appears, that customer is gone.
Emotional loyalty, in contrast, is durable. It creates genuine brand advocates, not just customers.
Consider this: you might remain with your internet provider because switching is inconvenient (transactional loyalty). But you will tell everyone about the local café where the owner remembers your name and order (emotional loyalty). The café owner has built a far more profitable asset.
This is not a theoretical concept; it is a critical reality in today's market. Recent research has uncovered a significant gap between how brands perceive their performance and how customers in the UK actually feel. One study revealed that even among consumers who identify as loyal, a staggering 83% feel undervalued by those same brands.
The good news? The same study found that 'True Loyalty'—the kind built on emotional trust—has grown by 26% in the UK since 2021. This demonstrates that businesses investing real effort into customer sentiment are pulling significantly ahead of the competition. You can discover more insights from this UK customer engagement study to see the full picture.
Quantifying the Qualitative
Measuring sentiment may sound abstract, but practical tools exist to capture this qualitative data. The goal is to get a reliable pulse on customer feeling so you can factor it into your broader CLV strategy.
One of the most effective tools for this is the Net Promoter Score (NPS). It is a simple yet powerful survey that asks one key question: "On a scale of 0-10, how likely are you to recommend our company to a friend or colleague?"
Based on their answers, customers fall into three categories:
- Promoters (Score 9-10): Your brand champions. They are enthusiastic, loyal, and a source of positive word-of-mouth. They have the highest potential for long-term value.
- Passives (Score 7-8): Satisfied but unenthusiastic customers. They are vulnerable to competitive offers and lack active loyalty.
- Detractors (Score 0-6): Unhappy customers. They can actively damage your brand through negative reviews and feedback, often possessing a low CLV that can become negative when factoring in support costs.
By tracking NPS, you gain a leading indicator of future customer behaviour. A rising NPS score often correlates with a future increase in CLV, while a falling score can be an early warning of churn.
Weaving Sentiment into Your CLV Model
With this sentiment data, how do you connect it to your hard financial calculations?
The key is segmentation. You can make your standard CLV models significantly more powerful by layering in your NPS results.
Start by calculating CLV for each of your three NPS segments: Promoters, Passives, and Detractors. You will almost certainly find that your Promoters have a significantly higher CLV than the other groups. They will likely buy more often, remain customers longer, and possibly spend more per purchase.
This segmented analysis transforms a qualitative feeling into a quantitative fact. It provides a clear financial incentive to move customers up the loyalty ladder—from Detractor to Passive, and from Passive to Promoter. Your strategy shifts from simply acquiring customers to actively creating more Promoters, the most sustainable path to growing your overall customer lifetime value.
Using AI to Predict Future Customer Value
The predictive models we've explored offer a powerful lens for looking into the future, but they often rely on broad averages. This brings us to the next frontier of CLV: leveraging Artificial Intelligence to transform this calculation from a static snapshot into a dynamic, real-time predictive powerhouse.
Standard formulas are an excellent starting point, but they tend to treat all customers within a segment as if they behave identically. AI-driven tools transcend these basic inputs. They are engineered to analyse vast, complex datasets for each individual customer, delivering a level of precision previously unattainable.
Going Beyond Basic Formulas
AI does not just look at what a customer bought and when. It processes a much richer tapestry of behavioural data to understand the why behind their actions. This involves analysing details that traditional models cannot handle at scale.
These sophisticated systems can track and interpret signals like:
- Browsing Behaviour: The time spent on certain product pages, items added to a cart but not purchased, and the specific navigation paths taken through your website.
- Service Interactions: The sentiment and urgency in support tickets or live chat transcripts, identifying frustration or delight long before a customer considers leaving.
- Social Sentiment: Public commentary about your brand on social media, providing a real-time pulse on brand perception and loyalty.
By processing these varied data points, AI builds a unique profile for every customer. This allows for incredibly accurate, individualised predictions of their future spending and, crucially, their likelihood of churning.
An AI model might notice a high-value customer has stopped opening your marketing emails and recently visited the cancellation page without completing the action. This is a significant churn signal that a traditional formula would completely miss, enabling your team to intervene and proactively save the relationship.
The Power of Predictive Personalisation
This depth of insight isn't just about obtaining a more accurate CLV number; it's about using that knowledge to take action. The most advanced businesses are using AI to build deeper, more profitable relationships by personalising the entire customer journey.
For instance, an AI model could identify a customer segment that consistently buys one type of product but ignores a complementary service. It can then trigger a highly targeted marketing campaign illustrating how that service solves a problem for them, creating a natural upsell opportunity that feels helpful, not intrusive.
The methodology to calculate Customer Lifetime Value has become incredibly reliable in the UK retail and ecommerce sectors due to these AI advancements. A recent report highlights that modern businesses are now using sophisticated AI-driven tools to track CLV more accurately than ever. This precision is vital as investors focus on sustainable growth, and UK retailers using these insights can more effectively monitor browsing patterns, purchase frequency, and service interactions. You can dive into more findings on this trend in the full UK State of Commerce Report.
Implementing AI for Smarter CLV
Incorporating AI into your workflow might seem like a project reserved for corporate giants, but it is becoming far more accessible. Many modern CRM and marketing automation platforms now have built-in AI features that can deliver these insights without requiring a dedicated data science team.
For businesses with unique requirements, building a bespoke system is also a realistic option. If you are curious about what such a project entails, you can read our guide on how much custom software development costs.
Ultimately, the goal is to shift from reactive analysis to proactive engagement. Instead of calculating CLV to see what a customer was worth, you use AI to predict what they could be worth—and then take specific actions to make that potential a reality. This is how you stay ahead of the competition and build a genuinely future-proof business.
Got Questions About CLV? We’ve Got Answers.
As you begin to integrate Customer Lifetime Value into the rhythm of your business, questions will inevitably arise. This is a positive sign, indicating a move from theoretical knowledge to practical application.
Drawing from our extensive experience helping businesses master this metric, we've compiled answers to the most common questions we encounter. This is not abstract advice, but practical guidance to help you overcome the usual hurdles.
How Often Should I Recalculate CLV?
The ideal frequency for recalculating CLV depends on the pace of your business. There is no one-size-fits-all answer, but there is a correct approach for your specific model.
For fast-moving sectors like e-commerce or retail, we recommend a quarterly or even monthly review. Customer habits can shift rapidly with market trends, and frequent calculations allow you to stay agile. You can spot changes in buying patterns or loyalty almost as they happen and adjust your marketing accordingly.
For subscription businesses like SaaS, a bi-annual or annual recalculation is typically sufficient. With more predictable revenue, the focus shifts to long-term trends like churn and expansion revenue. It makes sense to align your CLV check-ins with your broader strategic planning cycles.
The bottom line is this: CLV is not a "set it and forget it" metric. Treat it as a living number that should guide your campaigns, budget discussions, and strategic pivots.
What Is a Good CLV to CAC Ratio?
This is one of the most critical questions you can ask, as it cuts to the heart of your business's financial health. The CLV to Customer Acquisition Cost (CAC) ratio indicates the value you generate for every pound spent to win a new customer.
For a healthy, growing business, the widely accepted benchmark is a 3:1 ratio. This means for every £1 spent on acquisition, you generate £3 in lifetime value—a clear signal of a sustainable and efficient growth model.
- A 1:1 Ratio: This is a major red flag, indicating you are breaking even on each customer. There is no profit to fuel growth.
- A 3:1 Ratio: This is the ideal target, demonstrating a solid business model with healthy margins.
- A 4:1 Ratio or higher: This signifies a highly efficient marketing and sales engine, providing ample capital to reinvest in accelerated growth.
While a high-growth startup might temporarily dip below 3:1 to capture market share, the long-term goal for any resilient business should be to meet or exceed this standard.
Can I Calculate CLV Without Years of Data?
Absolutely. This is a common concern for new businesses, but a short history should not prevent you from using predictive CLV. You simply need to be resourceful.
Instead of a long history, you can leverage early cohort data or industry benchmarks to estimate customer lifespan. For instance, if you observe a 5% monthly churn rate across your first customer cohorts, you can forecast an average customer lifespan of 20 months (1 / 0.05).
You then combine that estimated lifespan with your early, real-world data on average order value and purchase frequency. This allows you to build your first predictive CLV model. While it won't be perfect, it provides a vital starting point. As you gather more of your own data, you can continually refine the calculation, making it more accurate each quarter.
How Do I Use CLV for Customer Segmentation?
This is where CLV truly becomes a strategic tool. Using it for customer segmentation allows you to move beyond basic demographics and group customers based on their actual value to your business.
Here is a simple framework we have seen deliver excellent results for our clients:
- First, calculate the CLV for every customer.
- Next, group them into value tiers. A classic approach is to create three segments: 'High-Value Champions' (top 10-20%), the 'Loyal Mid-Tier' (next 40-50%), and the 'At-Risk/Low-Value' group (bottom 40%).
- Finally, tailor your engagement strategies for each distinct group.
Your High-Value Champions might receive exclusive perks, early access to new products, or a dedicated account manager. For the Loyal Mid-Tier, you could roll out targeted upsell campaigns or a loyalty programme. For the At-Risk segment, you might use a re-engagement email series or offer a special incentive to win them back. This data-driven approach ensures your marketing budget is allocated where it will have the greatest impact.
At Make IT Simple, we specialise in turning complex business challenges into streamlined, effective SaaS platforms. If you're ready to build a system that not only calculates CLV but helps you act on those insights to drive recurring revenue, we can help. Book a consultation with us today to see how we can bring your vision to life.